Recommendations by band
| Band / frequency | Selection based on published data |
|---|---|
| 80 m / 3.5–4 MHz | MyAntennas: about 9.9 kΩ total and 7.5 kΩ resistance at 3.8 MHz. The 1115d is above 2 kΩ per its description. Palomar shows roughly 32 dB attenuation. |
| 40 m / 7 MHz | MyAntennas leads the impedance evidence: 14 kΩ total versus over 5 kΩ for the 1115d. Palomar: approximately 34 dB. |
| 30 m / 10 MHz | MyAntennas: 14.3 kΩ total. The 1115d is also strong at approximately 9 kΩ. Palomar: approximately 35–36 dB. |
| 20 m / 14 MHz | Both impedance-tested units are strong: MyAntennas about 13.8 kΩ; 1115d over 10 kΩ. Palomar: approximately 37 dB. |
| 17 m / 18 MHz | MyAntennas about 13.5 kΩ; 1115d about 10 kΩ. Palomar approaches its strongest region at approximately 40–41 dB. |
| 15 m / 21 MHz | MyAntennas about 13.9 kΩ; 1115d over 8.5 kΩ. Palomar shows approximately 44–45 dB. |
| 12 m / 24.9 MHz | MyAntennas about 14.5 kΩ; 1115d about 6 kΩ. Palomar shows approximately 45 dB, near its deepest suppression. |
| 10 m / 28–29.7 MHz | MyAntennas is the first shortlist choice from impedance evidence: about 15.2 kΩ total and 14.4 kΩ resistance at 28.5 MHz. The 1115d is around 5 kΩ; Palomar shows approximately 37 dB. |
Palomar attenuation and unmarked 1115d values are approximate visual readings. These are conditional preferences, not a common-fixture test ranking.
Three chokes on a common modeled scale

How to read this graph: Higher values mean stronger choking in this comparison model. The left scale is equivalent choking resistance in thousands of ohms: 5 means 5,000 ohms; 15 means 15,000 ohms. The bottom scale is frequency in MHz.
This is an apples-to-apples circuit model, not a new common-fixture laboratory test. All curves express the equivalent positive series resistance that would produce the same attenuation between a 50-ohm source and 50-ohm load.
MyAntennas uses its published resistance and reactance. Balun Designs uses approximate readings of total impedance, treated as resistance. Palomar uses attenuation digitized from its original graph, assuming a calibrated 50-ohm series-insertion fixture. That fixture assumption has not been independently verified.
Calculated Palomar conversion: R = 100(10A/20 - 1) ohms, where A is positive attenuation in dB.
| Frequency | Approximate plotted attenuation | Equivalent resistance |
|---|---|---|
| 3.8 MHz | 31.9 dB | 3.8 kΩ |
| 7.15 MHz | 33.6 dB | 4.7 kΩ |
| 10.1 MHz | 34.9 dB | 5.5 kΩ |
| 14.2 MHz | 37.0 dB | 7.0 kΩ |
| 18.1 MHz | 40.4 dB | 10.4 kΩ |
| 21.2 MHz | 44.7 dB | 17.0 kΩ |
| 24.9 MHz | 44.9 dB | 17.5 kΩ |
| 28.5 MHz | 36.6 dB | 6.7 kΩ |
Values digitized from graphs are approximate; the displayed decimal places do not imply measurement precision.
Comparison in decibels
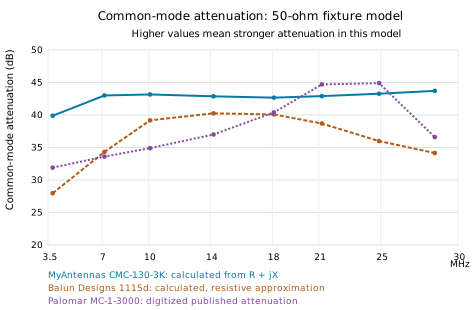
Higher is better in this model: greater positive dB means stronger common-mode current attenuation. 20 dB means 10 times less current amplitude, 30 dB about 32 times, and 40 dB 100 times.
| Band / MHz | MyAntennas dB | 1115d dB | Palomar dB |
|---|---|---|---|
| 80 m / 3.8 | 39.9 | 28.0 | 31.9 |
| 40 m / 7.15 | 43.0 | 34.3 | 33.6 |
| 30 m / 10.1 | 43.2 | 39.2 | 34.9 |
| 20 m / 14.2 | 42.9 | 40.3 | 37.0 |
| 17 m / 18.1 | 42.7 | 40.1 | 40.4 |
| 15 m / 21.2 | 42.9 | 38.7 | 44.7 |
| 12 m / 24.9 | 43.3 | 36.0 | 44.9 |
| 10 m / 28.5 | 43.7 | 34.2 | 36.6 |
MyAntennas is calculated from published complex impedance. The 1115d uses approximate total-impedance readings with a resistive assumption. Palomar comes from its published attenuation curve, with its negative transmission readings shown as positive attenuation. All are compared using the assumed 50-ohm source and 50-ohm load model.
This is not a prediction of receiver noise-floor reduction. It represents common-mode attenuation in the stated model. Installation impedance and other noise paths can change the result. This is not an independent common-fixture measurement of all three products; values read from graphs are approximate.
MyAntennas CMC-130-3K

Blue is total impedance, red is resistance, and green is reactance. High resistance remains broad across HF, with total impedance increasing toward 10 meters. This is the clearest published evidence for one choke spanning 80–10 meters, especially the upper HF bands. The manufacturer separately quotes up to about 41 dB attenuation in a 50-ohm system.
Balun Designs 1115d

Total impedance peaks around the middle HF bands and falls toward 10 meters. Favor it particularly around 30–17 meters; it remains a candidate for 40–10 meters. For stronger low-band choking, the manufacturer directs buyers toward its 1116d. The advertised power rating is conditional on load and frequency and is separate from choking effectiveness.
Palomar Engineers Maxi-Choker MC-1-3000

This plot shows common-mode transmission attenuation. More negative means stronger reduction in the fixture. Its deepest region is near 23–24 MHz, approaching 48 dB. Favor consideration around 17–12 meters; the graph also shows useful attenuation across 80–10 meters. Forty decibels means about 100 times less current amplitude in the test circuit, not necessarily on your coax.
Converting impedance and decibels
For a series choke impedance Zc in a test circuit with source impedance Zs and load impedance Zl, positive attenuation is:
A = 20 log₁₀ |(Zs + Zl + Zc) / (Zs + Zl)|
With a 50-ohm source, 50-ohm load and a purely resistive choke R:
A = 20 log₁₀(1 + R/100)
R = 100(10A/20 − 1) ohms
| Attenuation | Equivalent pure resistance in this fixture |
|---|---|
| 20 dB | 900 Ω |
| 30 dB | 3.06 kΩ |
| 40 dB | 9.90 kΩ |
| 48 dB | 25.0 kΩ |
One attenuation magnitude cannot uniquely reveal both resistance and reactance. Use complex S-parameter data or direct impedance measurement for that. Do not assume a coax shield's common-mode path has 50-ohm source and load impedances simply because the coax is rated 50 ohms. Actual suppression depends on the antenna, feedline, placement and common-mode return path.
Selection: MyAntennas has the strongest documented broad HF impedance of the two impedance plots, especially near 28 MHz. Palomar's attenuation plot makes it a credible candidate but cannot establish a direct winner without matching the test methods.
Addendum 5 kW comparison in ohms
This addition keeps the original three models and adds the MyAntennas CMC-330-5K and Palomar CMNF-5000HF. The Balun Designs 1115d was already advertised at 5 kW. All five curves below use the same conditional 50-ohm fixture model as the original comparison.

Higher is better in this model. Values below are equivalent positive series resistance in thousands of ohms, not measurements of power handling.
| Band | MyAnt 3K | MyAnt 5K | 1115d 5K | Palomar 3K | Palomar 5K |
|---|---|---|---|---|---|
| 80 m | 9.8 | 4.6 | 2.4 | 3.8 | 7.3 |
| 40 m | 14.0 | 6.1 | 5.1 | 4.7 | 6.4 |
| 30 m | 14.3 | 6.4 | 9.0 | 5.5 | 5.0 |
| 20 m | 13.8 | 6.6 | 10.2 | 7.0 | 3.4 |
| 17 m | 13.5 | 6.4 | 10.0 | 10.4 | 2.7 |
| 15 m | 13.9 | 6.2 | 8.5 | 17.0 | 2.2 |
| 12 m | 14.5 | 5.8 | 6.2 | 17.5 | 1.9 |
| 10 m | 15.2 | 5.4 | 5.0 | 6.7 | 1.5 |
The MyAntennas curves use published resistance and reactance; Balun Designs uses the earlier resistive approximation; both Palomar curves are inferred from their respective published attenuation graphs. Points are connected only as a visual guide.
Addendum 5 kW comparison in decibels

Positive attenuation in dB: higher means stronger modeled common-mode current reduction. This is not a prediction of receiver noise-floor reduction.
| Band | MyAnt 3K | MyAnt 5K | 1115d 5K | Palomar 3K | Palomar 5K |
|---|---|---|---|---|---|
| 80 m | 39.9 | 33.5 | 28.0 | 31.9 | 37.3 |
| 40 m | 43.0 | 35.8 | 34.3 | 33.6 | 36.2 |
| 30 m | 43.2 | 36.3 | 39.2 | 34.9 | 34.2 |
| 20 m | 42.9 | 36.5 | 40.3 | 37.0 | 30.9 |
| 17 m | 42.7 | 36.3 | 40.1 | 40.4 | 29.0 |
| 15 m | 42.9 | 35.9 | 38.7 | 44.7 | 27.3 |
| 12 m | 43.3 | 35.4 | 36.0 | 44.9 | 25.9 |
| 10 m | 43.7 | 34.8 | 34.2 | 36.6 | 24.1 |
What changes? The MyAntennas 5K model has a higher advertised power rating but lower published choking impedance than its 3K model. Near 10 meters, the calculated attenuation is about 35 dB versus about 44 dB for the 3K, a difference of roughly 9 dB in this fixture model. The Palomar 5K filter favors lower HF frequencies, while the original 3K Maxi-Choker has its strongest region near 15 and 12 meters.
Looking only at the 5K choices: Palomar is strongest near 80 meters in these curves. Around 40 meters it is close to the MyAntennas 5K. Balun Designs is a strong middle-HF choice, especially 30 through 15 meters. Near 12 and 10 meters, Balun Designs and MyAntennas 5K are close enough that small modeled differences should not decide the purchase by themselves.
Original measurement graph for MyAntennas CMC 330 5K

The original graph supplies the resistance and reactance used in the addendum calculations. Its numerical graph labels take precedence over the inconsistent web table entries described in the source notes.
Original measurement graph for Palomar CMNF 5000HF

This is the manufacturer curve from page 7 of its manual. Both the graph caption and the model table identify the CMNF-5000HF as rated at 5000 watts PEP.
Addendum sources and rating notes
Three choices advertised at 5 kW: MyAntennas CMC-330-5K, Balun Designs 1115d, and Palomar CMNF-5000HF. These are manufacturer power ratings under their stated conditions, not a standardized high-power endurance test. Frequency, mode, duty cycle, mismatch, and common-mode current can affect usable power.
The Palomar 5K is a different product family from the original Maxi-Choker. Its manufacturer describes it primarily as a station-end coax noise filter. It should not be described as simply the same 3K choke with a larger power rating.
MyAntennas CMC-330-5K manufacturer page. Calculations use the numerical labels on its original measurement graph. That graph gives about 6.4 kΩ resistance at 10.1 MHz, whereas the web table says 4.6 kΩ; the graph also resolves the reactance sign at 24.9 MHz. These discrepancies should be clarified with the manufacturer before using the values as precision specifications.
Palomar 1500/5000-watt product options and manufacturer manual, CMNF-5000HF curve on page 7. The manual model table, graph caption and current 5000-watt option identify this as the 5 kW model.
Balun Designs 1115d specifications and the original three-model source links above remain applicable.
Representative frequencies differ slightly across sources: the new MyAntennas markers are 3.75, 7.15, 10.1, 14.0, 18.1, 21.2, 24.9 and 28.0 MHz. The original series use their earlier reference points, including 3.8, 14.2 and 28.5 MHz. Tables align by amateur band, not identical test frequency. Palomar values are digitized approximations. Decimals reflect calculations rather than demonstrated precision.
The simple takeaway: choose a choke for the frequencies you use and the power conditions it must survive. A 5 kW label gives a different power-handling claim; it does not automatically give more choking than a 3 kW model.
RF Guru added to the comparison in ohms
The original five models remain. These two additional RF.Guru models use manufacturer band-by-band impedance tables rather than a continuous manufacturer sweep plot. The connected points are our comparison graphic, not a newly measured curve.

Higher values indicate greater equivalent choking resistance under the stated model. RF.Guru publishes impedance magnitude rather than the resistance and reactance needed for a full complex calculation, so those magnitudes are treated as resistance here. The 40-10 m model has no published 80 m point in the cited table; it is deliberately absent.
All original manufacturer plots and earlier three- and five-model comparisons are retained above.
RF Guru added to the comparison in decibels

Higher positive dB means stronger modeled attenuation. RF.Guru values are recalculated from its published impedance using A = 20 log₁₀(1 + |Z|/100), with the same 50-ohm source and 50-ohm load as this blog post. This assumes the RF.Guru impedance is resistive.
The manufacturer's own impedance-equivalent decibel column uses a different convention and is not copied into this graph. For example, the high-band model's 16.63 kΩ at 20 m becomes about 44.5 dB in our model, rather than its published 56.5 dB. This difference is mathematical normalization, not a measured loss of performance.
These figures describe a common test-circuit model, not guaranteed receiver-noise reduction or installed current suppression. No new common-fixture laboratory test has been performed.
RF Guru published data and reading guide
| Band | High band kΩ | Our dB model | Wideband kΩ | Our dB model |
|---|---|---|---|---|
| 80 m | — | — | 32.00 | 50.1 |
| 40 m | 4.85 | 33.9 | 12.00 | 41.7 |
| 30 m | 14.21 | 43.1 | 4.00 | 32.3 |
| 20 m | 16.63 | 44.5 | 3.20 | 30.4 |
| 17 m | 6.39 | 36.2 | 2.80 | 29.2 |
| 15 m | 4.51 | 33.3 | 2.40 | 28.0 |
| 12 m | 3.35 | 30.8 | 2.00 | 26.4 |
| 10 m | 2.73 | 29.0 | 1.60 | 24.6 |
RF.Guru 5 kW ICAS Quad Core High Bands 40-10 m: the manufacturer table supplies the impedance values shown here. Its specification describes up to 5 kW ICAS with an N-type connector under a 50-ohm load, while the PL-259 version has a lower stated rating.
RF.Guru 10 kW ICAS Quad-Core 160-10 m Wideband: this is the larger low-band-favoring model. The product page gives different limits by connector and band; its headline should not be read as an unconditional 10 kW rating across HF. Confirm the exact configuration and duty-cycle limits before selecting it.
The tables give band labels rather than exact measurement frequencies. Our RF.Guru markers use representative frequencies of 3.8, 7.15, 10.1, 14.2, 18.1, 21.2, 24.9 and 28.5 MHz solely for plotting alignment. They do not imply that the manufacturer tested at those exact frequencies. Do not treat connecting lines as evidence of intervening resonances or bandwidth.
What changes in the recommendations? The RF.Guru wideband model has the strongest modeled 80 m result among these seven, based on its published 32 kΩ magnitude. The RF.Guru high-band model looks attractive around 30 and 20 m, peaking in its table at 20 m. It falls toward 10 m, so its high power rating does not make it the strongest 10 m choke here.
For 10 m, MyAntennas CMC-130-3K retains the strongest modeled result. For 15 and 12 m, the Palomar 3K remains strongest in these plots. The comparison still depends on source data, resistive approximations and different original measurement methods.
The easy version including RF Guru
All seven are candidates worth comparing. Here is my simple reading of these published curves and the common circuit model, rather than a guarantee for every station.
Shopping in the 3 kW class? MyAntennas CMC-130-3K is my all-round choice for 80 through 10 meters, especially 10 meters. Palomar MC-1-3000 is particularly attractive near 15 and 12 meters, where its modeled suppression is strongest.
Shopping in the 5 kW class? Among the original three 5 kW choices, Palomar CMNF-5000HF has the strongest modeled result near 80 meters. Around 40 meters it is close to the MyAntennas CMC-330-5K. Balun Designs 1115d stands out across the middle HF bands, especially 30 through 15 meters. On 12 and 10 meters, Balun Designs and MyAntennas 5K are close; I would also weigh connectors, mounting, duty cycle and manufacturer support instead of buying on a fraction of a decibel.
Where do the RF.Guru models fit? The wideband model is the low-band specialist in these plots, with the strongest 80 m result. The high-band model is a strong additional 5 kW candidate around 30 and 20 m, with the highest modeled 20 m value among these seven. Neither RF.Guru model leads on 10 m. Their power ratings depend on connector, band and operating conditions, so compare the exact configuration rather than the largest number in the product name.
Choosing 3 kW versus 5 kW? First choose a model rated for your intended power, mode and installation. Then choose the strongest suitable choking curve on your bands. The 5 kW label does not automatically mean more suppression: the MyAntennas 3K curve is stronger than its 5K curve across the bands compared here, and the two Palomar products favor different frequency ranges.
My quick picks: for a strong all-round curve or mostly 10 meters, MyAntennas 3K. Mostly 15 and 12 meters, Palomar 3K. If higher power-rated hardware is needed, compare the exact connector and duty-cycle limits first: RF.Guru wideband is the 80 m specialist in these plots, and RF.Guru high-band is especially attractive on 20 m. Balun Designs remains a solid middle-HF option. On 12 and 10 meters, the original MyAntennas 5K and Balun Designs curves are stronger than either RF.Guru curve shown here. Palomar 5K remains worth considering for lower-HF station-end filtering.
Power ratings are manufacturer claims under specified conditions, not proof of identical continuous-power capability.
Operator Responsibility and RF Safety
This blog post is for general information. You are responsible for selecting, installing, and operating your own equipment safely. The author makes no guarantee of performance or safety for your particular installation.
Before transmitting with any antenna system, complete an RF-exposure evaluation using appropriate calculations or other accepted methods. Reevaluate whenever changes could affect exposure. A common-mode choke does not replace an RF-exposure evaluation or guarantee safe exposure levels.